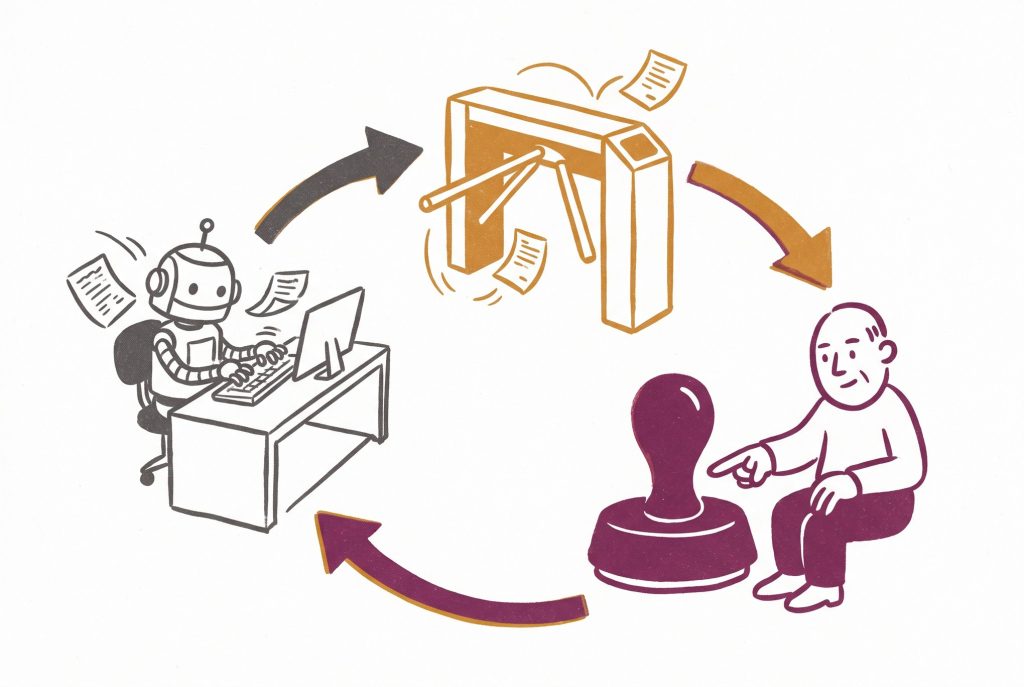
I run this site myself, and I’m building an AI site manager together with my agent team. It reads a site the way an editor would, proposes careful changes, I approve them, and it applies them to my own pages. First client: me. That’s deliberate. If the thing is wrong, it’s wrong on my site, and I’m the one who has to live with it.
One morning in early August I was walking through my queue of approved edits and hit an uncomfortable truth. The loop had two acts: understand, then act. Understand a page, propose an edit, apply it. And then… silence. Nothing in the system could tell me whether any of those edits had been worth making. Not “the metrics are bad”, worse: there were no metrics wired to the question at all. Neither I nor the product knew if we were helping.
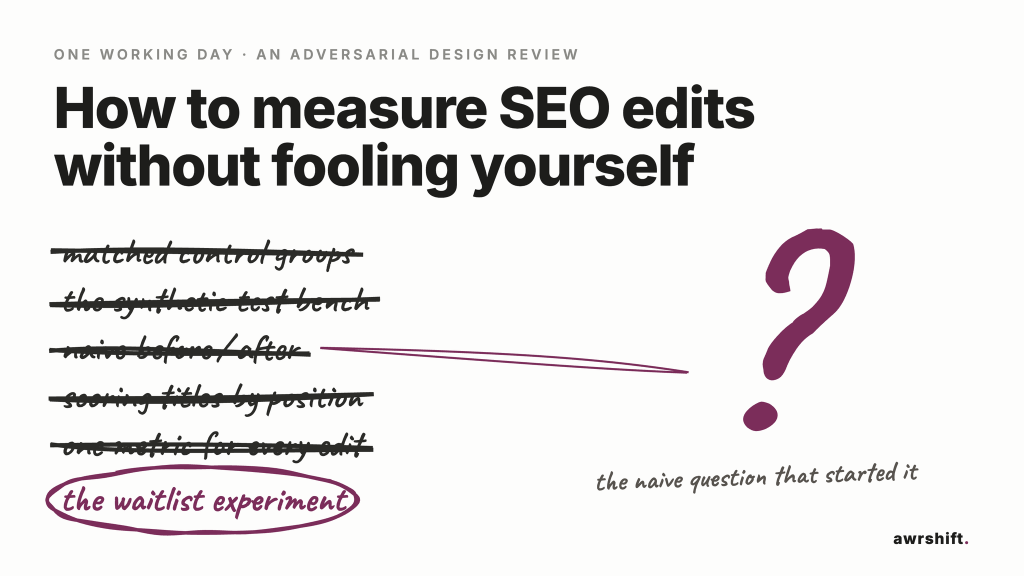
So that became the working day: design measurement. What follows is the actual session, in order, nothing invented. It ran the way my team always runs, which is the real subject of this article. I work with my AI the way a founder works with a lead: we discuss, we disagree, we decide. The lead delegates to specialists, researchers who go and read the sources, reviewers briefed to tear a design apart, and brings back synthesized results for a joint decision. The whole ritual would look familiar in any strong engineering org. It just happens at agent speed.
The obvious design, and why it lies
We started with the textbook sketch. Take each edited page, pull its clicks and impressions from Search Console, compare before and after. Simple, honest-looking, done by lunch.
Then the research sprint came back, and the picture stopped being simple. The whole field is sitting inside one big confounder: clicks are declining for everyone, independent of anything you do to your pages. SparkToro’s 2024 study, on a Datos panel, put zero-click searches at 58.5% of US Google searches. By mid-2026 Rand Fishkin was reporting, on a Similarweb panel this time, that “in the first four months of 2026, a whopping 68.01% of Google searches ended without a click.” Different panels, different users; Fishkin himself calls the comparison “a bit of apples and oranges.” And that spread is exactly the point. Nobody can hand you one clean number, but every panel agrees on the direction: an ever-larger share of searches ends without a click to the open web. Ahrefs measured the same pressure from the AI side in April 2025: position-1 CTR on informational queries fell from 0.056 to 0.031 in a year, and keywords with an AI Overview compressed harder still.
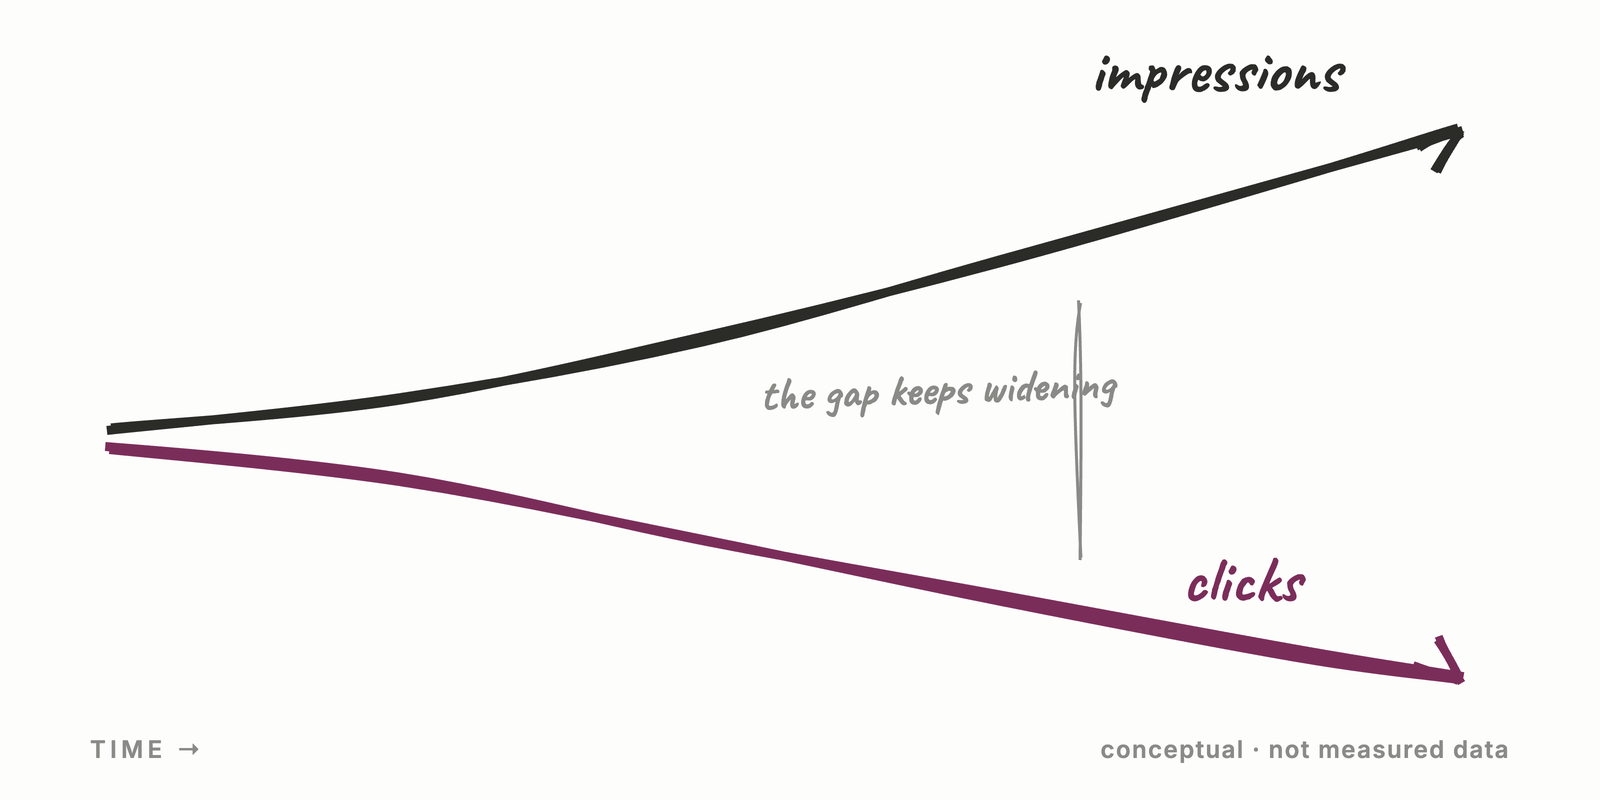
Which means naive before/after is biased toward false failure. You improve a page, its clicks still drop 5% because everyone’s clicks dropped, and your dashboard reports that your work made things worse.
The textbook answer to a moving baseline is a control group. Compare edited pages not to their own past but to untouched pages of the same site over the same window. A hypothetical but typical shape: edited pages drop 5% while comparable untouched pages drop 20%. On the naive readout the edit “failed”. Against controls it preserved about 15 points of traffic. Same data, opposite verdict.
| Naive readout | Against controls | |
|---|---|---|
| Edited pages | −5% | −5% |
| Untouched pages (same site) | not looked at | −20% |
| Verdict | “the edit failed” | “the edit preserved ~15 points” |
That was the design by mid-morning: before/after per edited page, judged against same-site control groups. It felt solid. It had literature behind it. It was also about to get taken apart, partly by a question I almost didn’t ask.
A naive question with a scientific name
Somewhere in that discussion I stopped the agent and asked the question that had been bothering me: aren’t we just picking these groups arbitrarily? It felt too basic to say out loud. The design sounded scientific, control groups, baselines, and my discomfort was just… how do we know the split isn’t random dressing on top of a story we want to tell?
We did what we always do with discomfort: sent it to research instead of arguing about it. My discomfort turned out to have a scientific name: regression to the mean. You edit pages because they declined. Pages that decline tend to rebound on their own, that’s what noisy time series do. So a naive measurement credits the natural rebound to your edit. The effect is documented well beyond SEO; one peer-reviewed paper on difference-in-differences methods puts it plainly: matching treated units to controls based on pre-treatment outcomes “can introduce regression to the mean (RTM) bias into estimates of the treatment effect”, with simulations showing “inflated type I error rates as well as decreased power” (arXiv 1909.04706).
The deeper we read, the more serious the neighborhood got. Difference-in-differences is canonical econometrics; Card and Krueger’s 1994 minimum-wage study is the classic. Google itself published CausalImpact in 2015 for exactly this class of problem, and its documentation is blunt about the load-bearing assumption: “the package assumes that there is a set control time series that were themselves not affected by the intervention. If they were, we might falsely under- or overestimate the true effect.” SearchPilot has been running same-site SEO split tests commercially since around 2016.
And here’s the beat I didn’t expect. As of August 2026, SearchPilot’s public testing-methodology page describes outlier detection, clustering, forecast adjustment, A/A false-positive rates, and does not mention regression to the mean or the specific trap of selecting declined pages for treatment. (I checked the page myself; so did two of my agents, independently.) My “naive” question was pointing at a hole that the industry’s flagship vendor doesn’t document on its methodology page.
I want to be careful here, because the lesson isn’t “I’m smarter than SearchPilot”. I’m not. The lesson is that the basic-sounding question, asked out loud, was worth more than my embarrassment about asking it. Hold that thought; the panel will make it worse.
Grounding on 7,379 real pages
Before trusting the design, we grounded it. Not on synthetic examples, on a real site we had already scanned end to end: a large publisher site of 7,379 pages that we analyze. (Not mine, so it stays anonymous.)
The scan data broke it down into 1,308 real articles versus 6,037 theme-generated listing pages, spread across 24 topics, with the biggest topic strata running 90 to 105 articles each. That matters for controls: if you edit 20 articles in a topic, 68 to 85 same-topic articles remain untouched as candidate controls. And grouping doesn’t have to be arbitrary, which was the answer to my morning discomfort: groups can be built from stable attributes the scan already knows, topic, page type, age, content class. Constructible, not vibes.
So now we had a design and real strata to run it on. Time for the part of the process I’ve come to trust most.
Putting our own hypothesis on trial
Here’s the ritual. The hypothesis gets frozen in writing first, so nobody can quietly move the goalposts later. Then six independent reviewers get briefed on the same frozen text, each through a different lens: statistics, the data layer, simulation epistemics, product utility, prior-art failures, and one reviewer from an external model family entirely, so the panel doesn’t share one set of blind spots. The brief is not “review this”. The brief is “refute this”. Verdicts come back on a three-step scale: fatal, repairable, cosmetic. And then the judge, me together with my lead agent, re-verifies every load-bearing claim by hand before accepting it. A reviewer saying “this breaks” counts for nothing until we’ve reproduced the break ourselves.
The same discipline travels outside measurement. I later pointed it at protocol documentation and found four documented behaviours that my own server did not have, which is the kind of thing you only see if you write the expectation down before you look.
The panel came back and the kills landed one after another.
Statistics: our matching rule maximized the bias we were trying to avoid. Same-topic controls are the edited page’s direct competitors in search. When your improved page wins impressions, part of that win comes from the very pages you’re using as a baseline, so the edit’s measured effect inflates itself. The better the topical match, the worse the lie. Our most careful instinct, match tightly!, was the most poisoned one.
The better the match, the worse the lie.
Simulation: a synthetic test bench proves your code, not reality. Three lenses converged on this independently. If the data generator embeds your assumptions, then passing the test is a tautology; you’ve verified that your math agrees with itself. The literature has a number for how badly this family of methods behaves on real data: Bertrand, Duflo and Mullainathan showed in 2004 that naive difference-in-differences on serially correlated data produced false positives around 45% of the time against a nominal 5%. Placebo tests on real history, not simulations, are what earn trust.
The data layer: Search Console attributes metrics to the Google-chosen canonical. Not to the URL you edited, to whatever URL Google currently considers canonical for that content. A title edit can flip that choice mid-measurement, silently moving the page’s clicks into a different row. The treatment can manufacture its own missing-data artifact. We’d have been reading holes in the data as effects.
Prior art: Google rewrites a large share of titles in the SERP anyway. Cyrus Shepard’s Zyppy study measured Google rewriting 61.6% of titles; a Q1-2025 study covered by Search Engine Land put the rate at 76%. And per Google’s own statements back in 2021, a rewritten SERP title is a display change, not a ranking change. So a title test scored on position is scored on the wrong metric, and scored on CTR without checking whether your title was even served is scored on a fiction. And a sobering base rate from the people who do this commercially: SearchPilot reports that roughly three quarters of their tests come back inconclusive, at traffic volumes far above mine.
Product: a number without a lever changes nothing. Even a perfect measurement is decoration if no action is wired to the readout. Measurement has to end in a decision rule, keep this class of edit, stop that one, or it’s a dashboard, and dashboards don’t compound.
Watching your own design get dismantled like this is genuinely uncomfortable. It’s also the point. Every one of those kills was available to me the whole time; I just couldn’t see them from inside my own enthusiasm. The panel is paid, in tokens and in briefing, to disagree with me. That’s not a safety feature bolted on top of the process. It is the process.
What survived
The panel didn’t just break things. Once the wreckage was on the table, a repair converged from several lenses at once, and it was better than what I’d started with.
The waitlist experiment. My queue of approved-but-not-yet-applied edits is itself a control group, and one nobody outside the system can have. Same pages, same flags, same decline patterns, already selected and already approved, just not applied yet. Randomize the order in which approved edits get applied, and the pages still waiting become controls for the pages already treated. The contested observational comparison quietly turns into an actual experiment, using nothing but the queue the product already has. The regression-to-the-mean trap closes too: waiting pages declined and were selected exactly the same way as treated ones, so the rebound bias cancels instead of accumulating.
Around it, the surviving rules from the review:
- Placebo runs on real history are the trust source. Run the full measurement pipeline on periods where no edits happened. If it “detects” effects there, it’s broken, whatever the simulations say.
- Per-edit-class metrics. Title edits get judged on impressions and CTR, never position; content edits get their own metric map. One score for “did the edit work” is how you lie to yourself politely.
- Pre-registered expectations. Most readouts will be inconclusive. Written down in advance, that’s honesty. Discovered after the fact, it becomes a temptation to torture the data.
- Below the power floor, describe, don’t “measure”. A small site section doesn’t produce enough signal for inference, and pretending otherwise is theater. State what happened; skip the verdict.
The checklist
Everything above compresses into eight lines. This is the card I’d hand anyone who edits pages for a living and wants to stop fooling themselves:
- Never read a page’s curve alone. Always against same-site controls matched on stable attributes.
- Never match controls on current traffic levels (the regression-to-the-mean trap).
- Verify pre-edit parallel trends, or label the readout unreliable.
- Score the metric the edit can actually move (title → CTR and impressions, not position).
- Verify the edited title is actually served in the SERP.
- Check canonical stability before and after.
- Expect most readouts to be inconclusive: that’s honesty, not failure.
- Below ~1,000 organic visits a day per section: describe, don’t «measure».
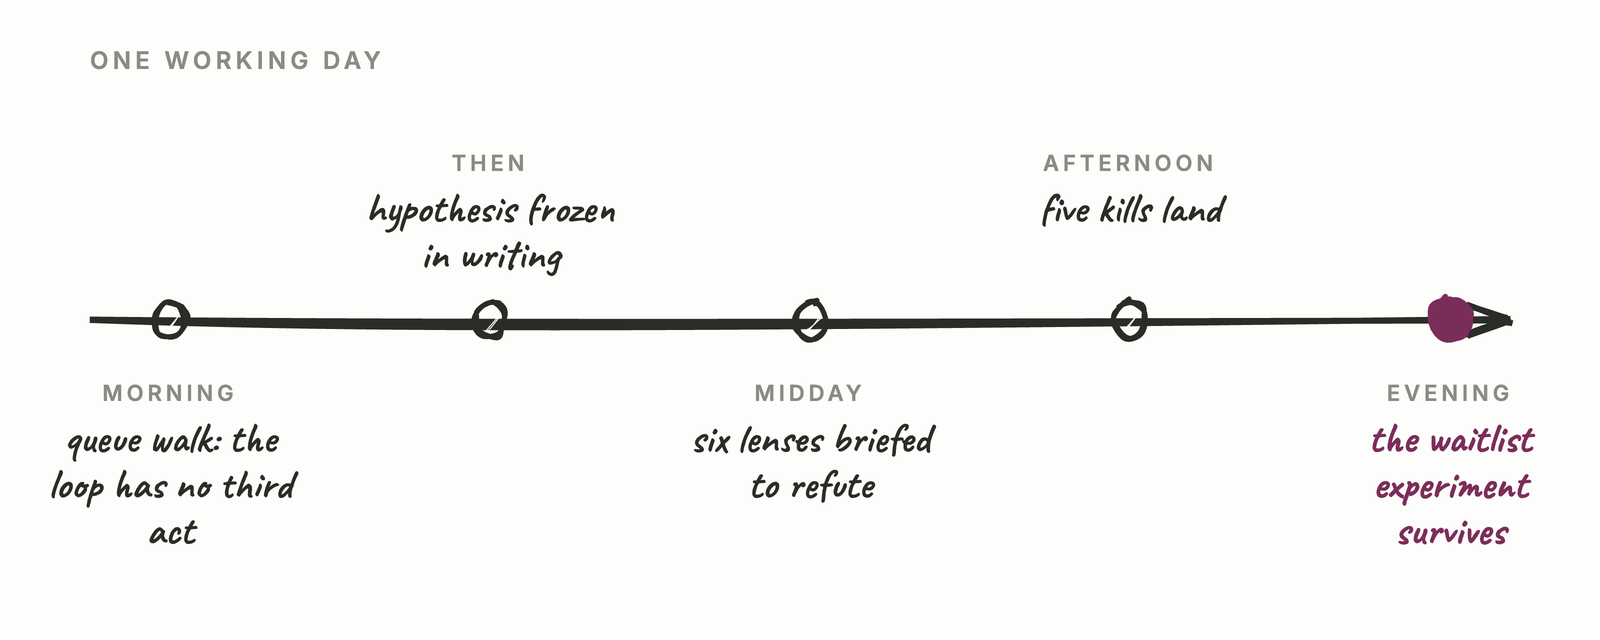
One working day. In the morning I had a queue of edits and no third act. By evening I had a design that survived six adversaries, a checklist, and one more piece of evidence for the thing I keep relearning: the method is the product. The same adversarial loop that gates my content decisions had just red-teamed my measurement design, and the most valuable contribution of the day was a naive question asked out loud to a panel that’s briefed to disagree.
I’m building the measurement itself on these principles now. Slowly, with the waitlist idea at the center. When it produces its first honest readout, inconclusive or not, I’ll write about that too.
Sources and notes
- SparkToro (Rand Fishkin), In 2026, Less than One Third of Google Searches Still Send a Click, 2026-06-09; Similarweb panel, Jan–Apr 2026. The cross-panel caveat is Fishkin’s own.
- SparkToro / Datos, 2024 Zero-Click Search Study, 2024-07-02.
- Ahrefs, AI Overviews Reduce Clicks by 34.5%, 2025-04-17; 300k keywords, March 2024 vs March 2025.
- Google, CausalImpact documentation (Brodersen et al., Annals of Applied Statistics, 2015).
- SearchPilot: testing methodology · Before you begin SEO testing (the 1,000-visits/day power floor) · Realizing the value of a good experimentation program (“Nearly 75% of tests are inconclusive”). All fetched 2026-08-05.
- arXiv 1909.04706: regression-to-the-mean bias in difference-in-differences designs.
- Bertrand, Duflo, Mullainathan, How Much Should We Trust Differences-in-Differences Estimates?, QJE 2004.
- Card & Krueger, Minimum Wages and Employment (AER 1994), the canonical difference-in-differences study.
- Zyppy (Cyrus Shepard), Google title rewrite study: “Google rewrote 61.6% of the titles.”
- Search Engine Land coverage of a Q1-2025 title study (76% rewritten); Google’s 2021 statements that a SERP title rewrite is a display change, not a ranking change.